|
|
|
The most important question in climatology today is whether the 0.6oC global warming during this century can be unequivocally related to human-induced changes in the chemical composition of the atmosphere. The few studies that have been undertaken try to match patterns of temperature change at the surface and in the atmosphere to expected patterns from coupled ocean-atmosphere general circulation models (1). One of the main reasons that a more conclusive statement than " ... the balance of evidence suggests a discernible human influence on climate" (2, p. 4) cannot be made is the relative shortness (about 100 years) of global-scale surface temperature records. In this context, a recent report by Mann et al. (3) reconstructs global-scale temperature patterns since 1400 with the use of widely distributed, high-resolution (annual time scale) proxy climate indicators (tree-ring widths and density, ice-core isotopes and melt layers, coral growth and isotopes, historical evidence, and a few long instrumental records). The Northern Hemisphere component of the reconstruction from 1600 is then compared through simple running correlations (with windows of 100 to 200 years), with time series representing past variations in greenhouse gases, solar irradiance, and volcanic aerosols. Solar irradiance changes are shown to play a role in controlling Northern Hemisphere temperatures in the 17th century, volcanic aerosols were a factor in the 18th and 19th, but greenhouse gases dominate during the 20th century.
The merits of the latter analysis may be questionable, there being a number of competing indices of past solar and volcanic variations (4), but how reliable are the reconstructed temperature patterns and the average Northern Hemisphere series? Almost all the available long (more than 200 years) proxy climate series have been used by Mann et al. (3), and if the new multivariate method of relating these series to the instrumental data is as good as the paper claims, it should be statistically reliable. Unfortunately, in using the few very long, mainly European, instrumental records, one gives up all hope of assessing the reconstruction quality before the mid-19th century. Here, the paleoclimatic community faces a dilemma with such a multiproxy approach. Should all available proxy records be used in any reconstruction of this kind, or should long instrumental series such as Central England Temperature (5) be held back to assess a reconstruction (from just the "natural" archives--trees, ice cores, and corals) over the longer term? In the detection issue (1, 2) posed at the beginning, it is the longer term variations (time scales of more than 30 years) that are the most important aspects of any reconstructed series.
Space limitations allow Mann et al. (3) to only briefly allude to the potential dating problems with some proxies and the potential time scale limitations with others. These are addressed in more detail, in the between-proxy context elsewhere (6). Simple comparisons with instrumental data indicate that, if ranked in descending order, the best proxies would be long instrumental records, followed by historical records, tree density, tree-ring widths, ice cores, and corals (7). The mathematical technique used by Mann et al. (3) to produce the reconstructions could easily be adapted to show which proxy series are the most important. Although Mann et al. (3) do not explicitly rank the various proxies, much of their success, in a statistical sense, must come from the large number of tree-ring width series used.
Each paleoclimatic discipline has to come to terms with its own limitations (6, 7) and must unreservedly admit to problems, warts and all. A particular issue for all ice core and coral series and some new tree-ring work is what exactly an isotope series (be it O, H, or C) tells us about past temperature. Sensitivity to temperature cannot be assumed; it must be proved with instrumental data on both interannual, and, where possible, on longer (more than 20 years) time scales (7). Each discipline has its own niche in studies of the past, but they should be considered complimentary rather than competitive. If more is done together, which is beginning with this type of multiproxy work (3, 7, 8), they can learn from one another and potentially make the whole greater than the sum of the parts.
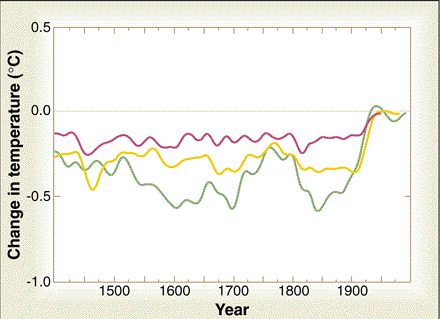
The figure shows the reconstruction of Northern Hemisphere temperatures from (3), comparing it with two others (7, 9) on the 50-year time scale since 1400. Some of the differences may be due to different seasons [annual in (3) and two definitions of summer in (7, 9)]. Given the presumed importance of the tree-ring data in all three, [(9) only makes use of tree-ring density] the latter would seem preferable. Despite the different methods of reconstruction and the different series used, or alternatively, because a few good ones are common to all three series, there is some similarity between the series. All clearly show the 20th century warmer than all others since 1400. The dramatic feature of all three records is the rise during the 20th century. The coolest centuries are the 17th and 19th, with the second half of the 15th cold in (3). Spatially the 17th is colder over Eurasia and the 19th colder over North America (7-9).

More multiproxy reconstructions of this kind need to be attempted, each improving on the last by incorporating new series and perhaps refining the multivariate methods used. Only a few tree-ring density series have been used in the multiproxy approach so far (3, 7, 8). More than 300 are now available in the high latitude and altitude regions of Eurasia and North America (9, 10). The quality of these (6-10) should enable the long instrumental records to be held back for meaningful long-term verification. Studies like those of Mann et al. (3) and others (7-9) are just a start. It is far, far better work that all paleoclimatologists need to do, better than they have ever done; it is far, far better reconstructions that are needed by the climate community.