QUASI-QUADRIENNIAL OSCILLATION
QUASI-QUADRIENNIAL OSCILLATION
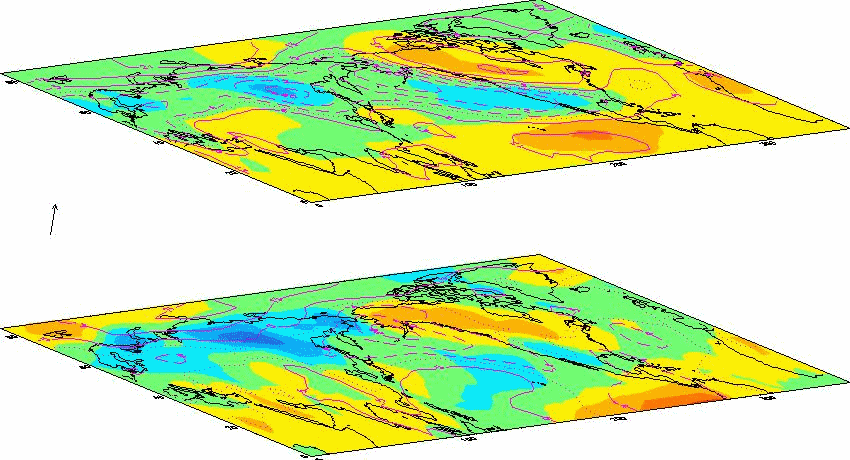
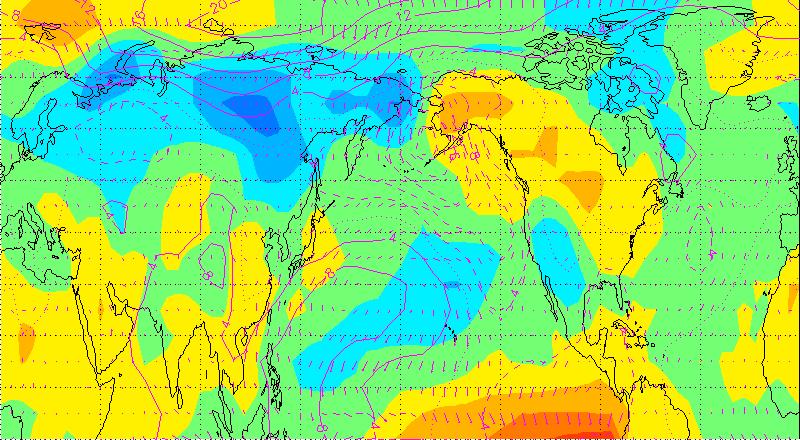
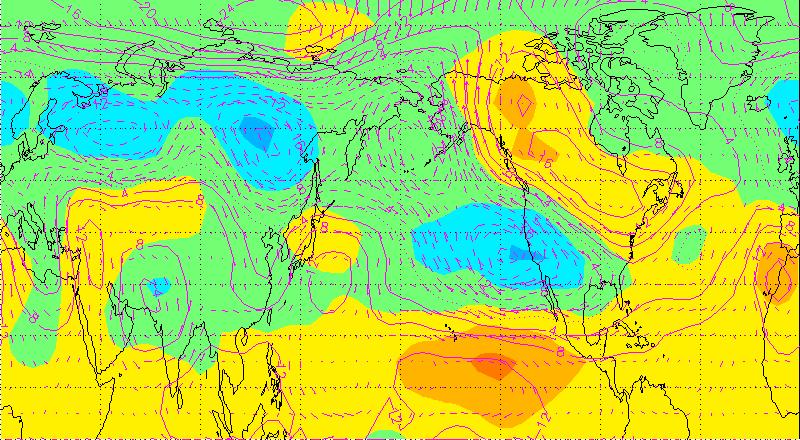
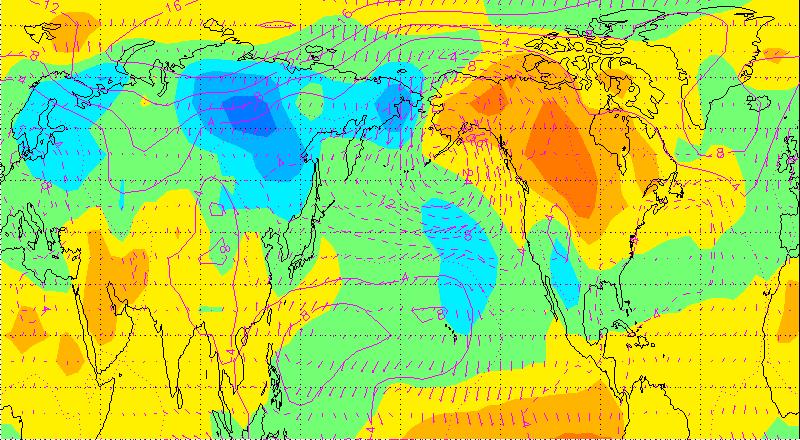
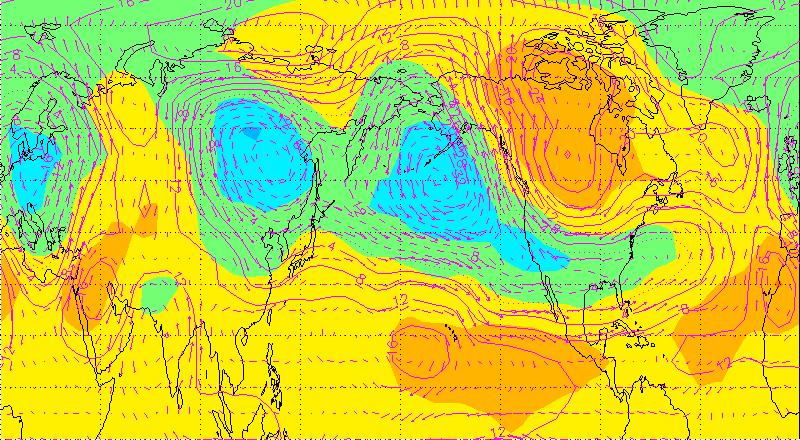
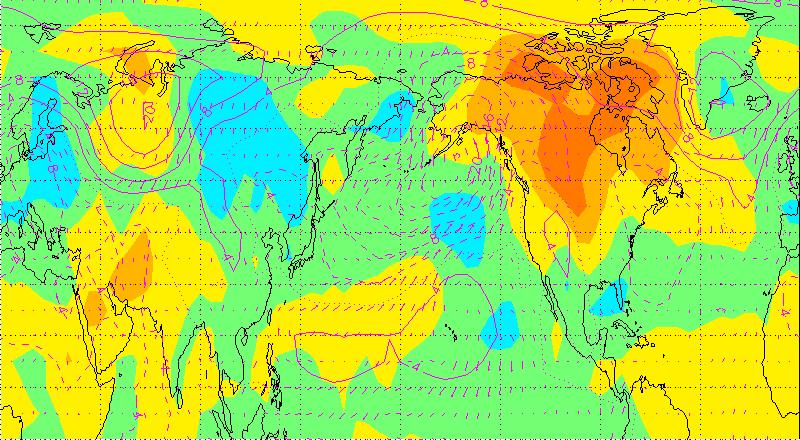
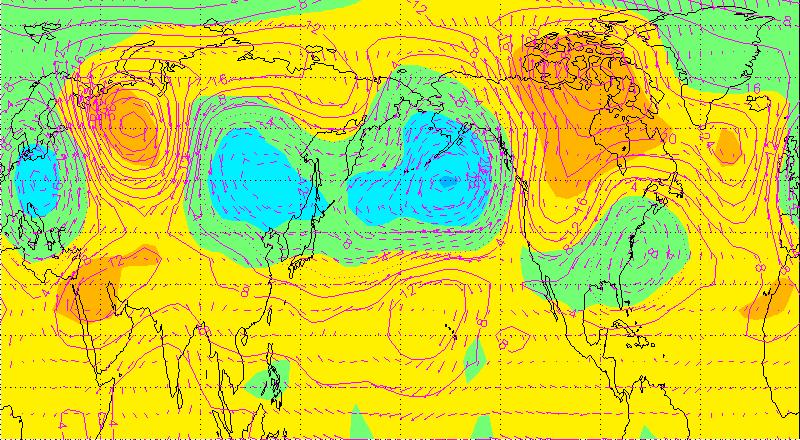
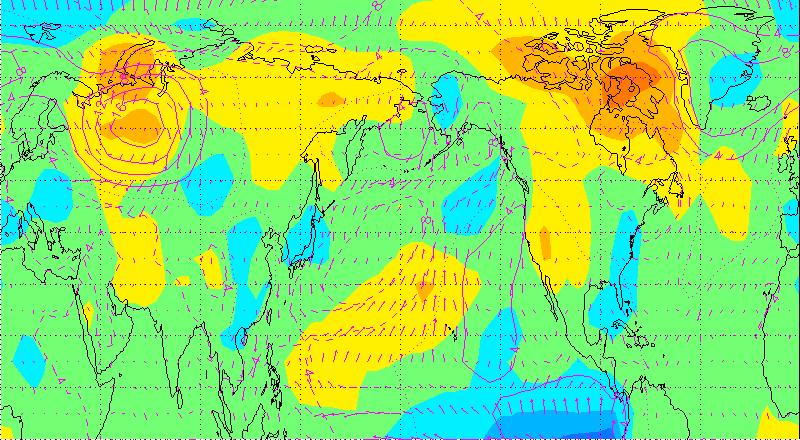
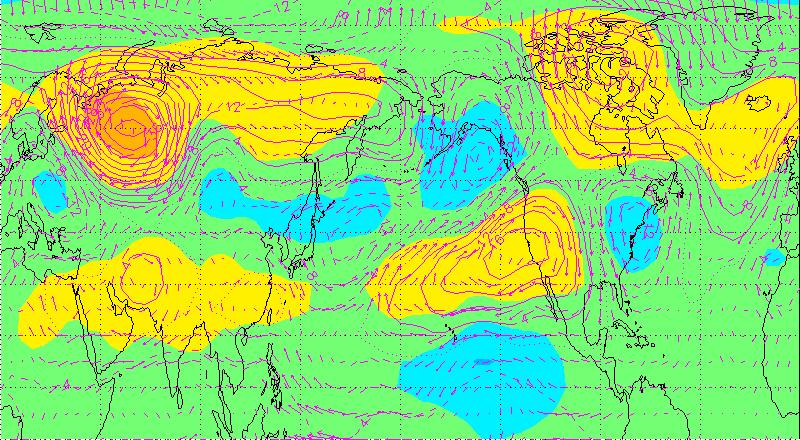
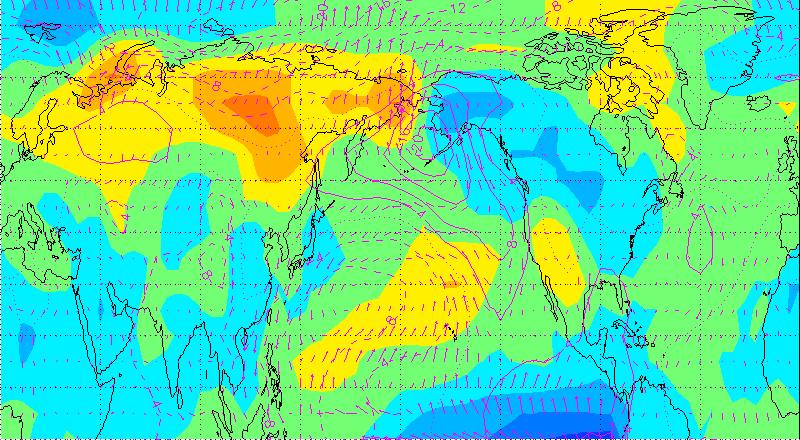
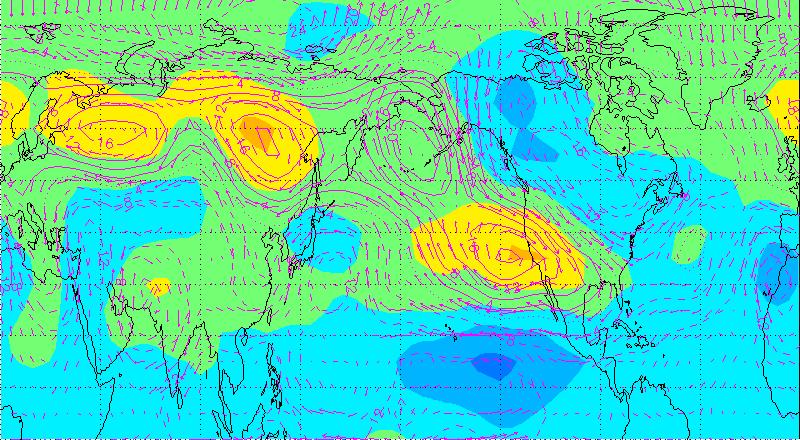
Spatial reconstructions of QQ oscillation for 1000 hPa (bottom) and 500 hPa (top) levels. Animation for a 5 degrees steps, from phase 0 to 355 (phase is indicated by small arrow to the left of QQ maps). Temperature anomalies are indicated by the asociated color scale. Geopotential height anomalies are indicated by (magenta) contours (solid line: positive anomalies, dashed line: negative anomalies, dotted line: zero contour, intervals shown indicate -12, -4, 0, 4, 12 m anomalies). QQ OSCILLATION: FOUR FIELDS
|
|
|
 |
 |
 |
 |
 |
 |
 |
 |
 |
 |