|
Pressure Definition
>> Pressure is force per unit area
>> Pressure is exerted by molecular collisions
Gases, unlike solids and liquids, do
not have their molecules tightly bound together. Instead, they move about
freely and frequently collide with one another and with adjacent surfaces.
When any molecule collides with another object, a force is exerted by the
molecule on that object. When all of these individual forces are added
together in a given area, it results in a pressure.
>> Standardized measurements
There are many different units in
which pressure can be measured - from the atmosphere to the pound per square
inch. However, meteorologists typically only use three of these pressure
measurement units. The two most commonly used pressure units are the
millibar and the inch of mercury - both of which are regularly used in broadcast
meteorology. The third unit, the Pascal, is the preferred standard
measurement of pressure. Figure 1, below, summarizes the various units
used to measure pressure and their relations to one another.
|
Units |
Pascals |
Millibars |
Inches of Mercury |
Atmospheres |
Pounds per Square Inch |
|
1 Pascal |
1 Pa |
.01 mb |
.000295" Hg |
.00000987 atm |
.000145 psi |
|
1 Millibar |
100 Pa |
1 mb |
.0295" Hg |
.000987 atm |
.0145 psi |
|
1" Hg |
3390 Pa |
33.9 mb |
1" Hg |
.0334 atm |
.491 psi |
|
1 Atmosphere |
101,000 Pa |
1010 mb |
29.9" Hg |
1 atm |
14.7 psi |
|
1 Pound per Square Inch |
6890 Pa |
68.9 mb |
2.04" Hg |
.068 atm |
1 psi |
|
Figure 1: This table gives an overview of the various units of
pressure measurement and how they are related to one another. |
>> Also acts in the horizontal (doesn't just "push down")
Pressure doesn't just act as a
force in the vertical, it also works to exert horizontal forces as well.
In fact, the horizontal component of pressure is a key variable in many
atmospheric processes. The gory details of many of these processes will be
discussed later this semester.
Atmospheric Constituents
>> Constant quantities: Nitrogen and
Oxygen account for 99% of dry air
The composition of dry air in the
atmosphere can be seen in Figure 2 below.
|
Gas Constituent |
Percent by Volume |
|
Nitrogen (N2) |
78.084% |
|
Oxygen (02) |
20.946% |
|
Argon (Ar) |
0.934% |
|
Carbon Dioxide (C02) |
0.0332% |
|
Trace Constituents |
0.0028% |
|
Figure 2:
This table outlines the composition of dry air at sea level. |
>> Variable quantities: Water vapor most important
While the composition of
atmospheric gases is fairly constant, there are some quantities that vary.
The most important of these quantities is water vapor. The amount of water
vapor in the atmosphere at any time can range from 0% to 4% by volume. The
amount of water vapor in the air at any time plays a large part in determining
various meteorological quantities from the relative humidity and the dewpoint to
when and where clouds will form.
Gas Law
>> Pressure depends on temperature and
density
The ideal gas law relates air
pressure, density and temperature. This law states that the air pressure is
proportional to the air density times the air temperature. This statement
becomes an equality if the density and temperature are multiplied by a constant
called the Universal Gas Constant.
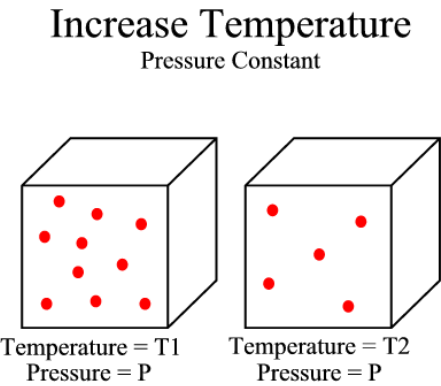
>> Increase temperature
|
 |
|
Figure 3:
This image illustrates the impact of an increase in temperature on a gas at
a constant pressure. Notice that as the temperature increase from T1
to T2, the density (number of molecules) must decrease if pressure remains constant. |
If there is an increase in air temperature and the pressure remains constant,
the air density must decrease. This is because in warmer air
the molecules are moving faster and exerting a greater force on the
surroundings, so in order to keep the pressure constant, less molecules are
needed to exert the same force. This relationship can be seen in Figure
3 to the left.
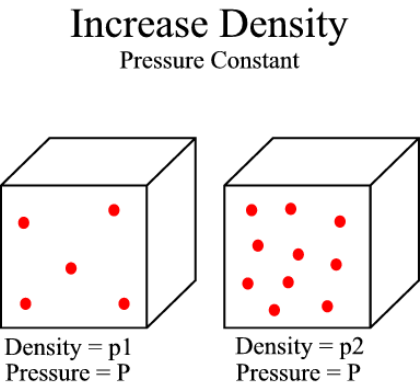
>> Increase density
|
 |
|
Figure 4:
This image illustrates the impact of an increase in density of a gas while
the pressure is held constant. Notice that when the density is
increased, more molecules are present in a given volume. In order to
achieve the same pressure, the molecules in the more dense gas must move
slower. This leads directly to a decrease in temperature. |
If, instead, the density of the gas increases and the pressure is to remain
constant, there must be a decrease in temperature. In this situation, an
increase in the density of a gas will cause more molecules to be contained in a
certain volume. Since there are more molecules in any given volume of air,
the molecules don't need to be moving as fast to exert the same force on the
surroundings. This leads directly to a decrease in the temperature of the
gas. Figure 4, to the right, illustrates this relationship.
Gravity and the Compressibility of Air
>> Weight of air above compresses air
below
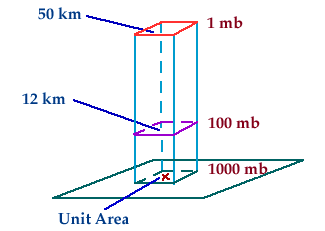
>> Pressure increases as altitude decreases
|
 |
|
Figure 5:
This figure illustrates how atmospheric pressure increases as altitude decreases. |
Atmospheric pressure can be defined as the
weight of a column of air above any given point in the atmosphere.
Therefore, it makes sense that the atmospheric pressure would increase as
altitude decreases. As the altitude
decreases, the amount of air molecules found above a given point will be
greater and, therefore, the weight of the air in that column will be greater.
This concept is illustrated in Figure 5 to the left.
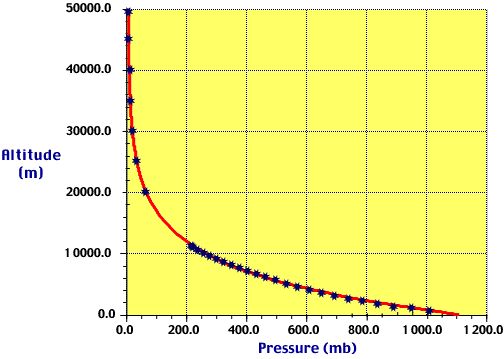
>> The atmosphere is very thin: compare it to an onion skin
|
 |
|
Figure 6:
This figure illustrates the fact that pressure decreases more rapidly near
the earth's surface than at higher altitudes. This is one of results
of gravity on our thin atmosphere. |
Earth's atmosphere is incredibly thin in comparison with the radius of the
planet. This property of the atmosphere can be attributed to gravity.
The force of gravity works to hold the air molecules found throughout the
atmosphere as close to the surface of the planet as possible. This basic
force causes more than half of the air molecules in the Earth's atmosphere to
reside below 5.5 kilometers. As a result, air pressure does not decrease
in a linear fashion. Instead, atmospheric pressure decreases more rapidly
near the surface than it does at higher altitudes. Figure 6, found
to the right, illustrates this principle.
Constant Height Maps and the Correction of
Station Pressure to Sea-Level Pressure
>> Removes effect of vertical
variations in pressure
The correction of station recorded
atmospheric pressure to sea-level pressure allows for vertical variations of
pressure to be disregarded. This process is completed by adding in the air
pressure of an imaginary column of air that would stretch down to sea-level.
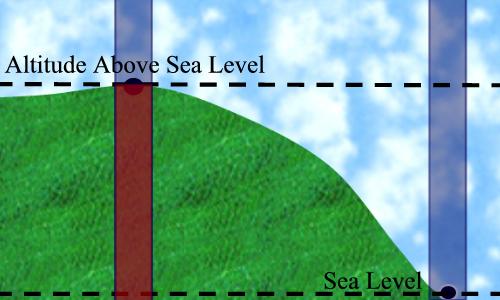
Figure 7, below, illustrates the correction of station pressure to
sea-level pressure.
|
|
|
Figure 7:
This figure illustrates how station pressure is adjusted to sea-level
pressure. The red portion of the column on the left is the amount of
air (pressure) that would be added to the station pressure if the point were
at sea-level. |
>> Horizontal pressure gradients are much smaller than vertical changes, but
they are critical in describing atmospheric motions
One way that meteorologists look at
variations in pressure is through the use of a constant height map. This
type of map allows the horizontal variations of pressure to be seen at any given
height. This can be helpful to meteorologists by allowing them to see
horizontal pressure gradients at a given height, which is crucial to
understanding and describing various atmospheric motions. The only constant
height map we will routinely use is the "sea-level" (height equals zero), or "surface" weather map.
Constant Pressure Maps: Analogous to Constant
Height Maps
>> Show lines of constant height along
a single pressure surface
|
 |
|
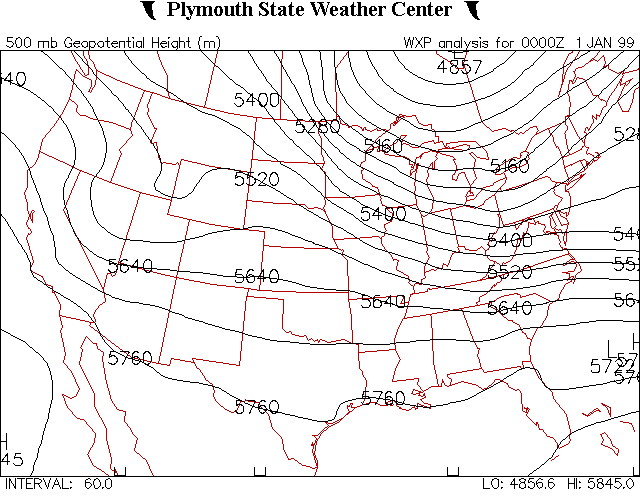
Figure 8:
The image above is of a constant pressure map. The map features
plotted lines of constant height on the 500 millibar pressure surface. |
A constant pressure map is analogous to a constant height map in that it
displays contours at a given level. In the case of a constant pressure
map, however, contours of constant height are plotted along a single pressure
surface, such as 500 millibars. This type of map essentially serves the same purpose
as a constant height map.
An example of this type of weather map can be seen in Figure 8 to the
left.
>> Warm column of air: Higher heights
at a given pressure surface or higher pressure at a given
height
>> Cold column of air: Lower heights at a given pressure surface or lower pressure at a given height
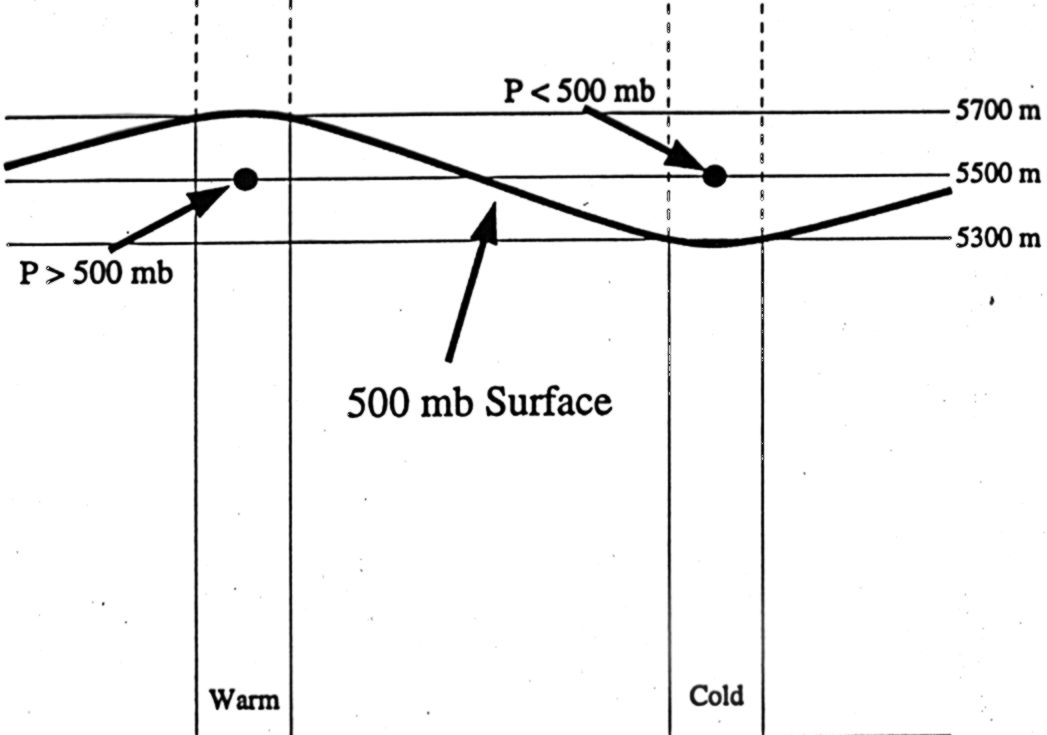
The two notes presented directly above
work to link the constant pressure and constant height maps together through one
concept. This concept is illustrated in the image below.
|
 |
|
Figure 9:
The picture above illustrates the impact temperature has on the two
different types of maps discussed above. Notice that the warmer column
of air has higher heights on the constant pressure surface and higher
pressures on the constant height surface as compared to the cold column of
air. |
|