Hurricanes, El Niño and Global Warming
A look at Some Frequently Misunderstood Meteorological Topics
Penn State Weather Workshop for Science Educators 2004
From NASA's Earth Science Enterprise 2002 Summer Workshop
Table of Contents
Topics - First Session, Part I
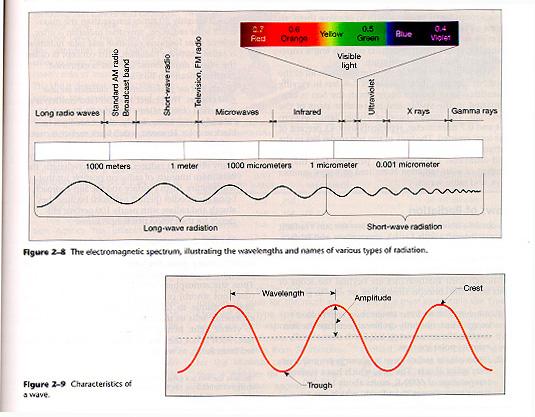
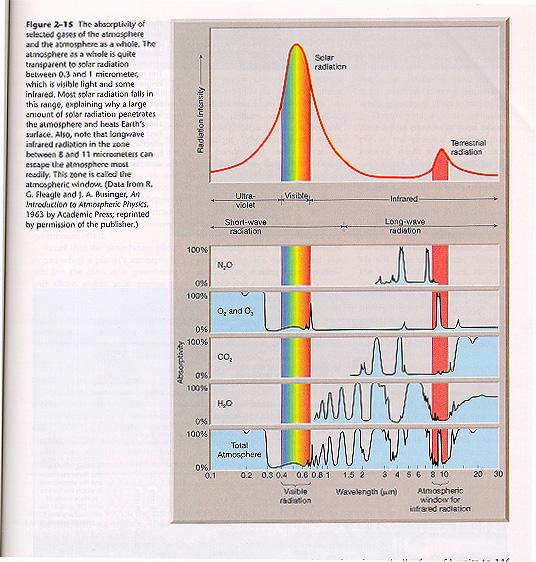
Radiation
Winds
The General Circulation of the Atmosphere: Tropical Emphasis
Exercise: Hurricane Frequency in the Atlantic and Eastern Pacific Basins
Topics - First Session, Part II
Global Warming - The Enhanced Greenhouse Effect
Land Use - The Urban Heat Island
Exercise: Temperature Trends
---------------------------------------------------
Topics - Second Session
Basic Air Pollution Meteorology
Sound Propagation in the Lower Atmosphere
Radiation: Basic Terminology
Radiation: Weather Radar and Satellite Images
Visible Infrared
Water Vapor
Colorized Infrared Image Composite Radar Image
Radiation: Global Balance vs Temperature


Winds
The General Circulation of the Atmosphere

The General Circulation: The Hurricane
Lab Exercise 1: El Niño and Hurricane Frequency
http://weather.unisys.com/hurricane/atlantic/index.html
http://weather.unisys.com/hurricane/e_pacific/index.html
http://weather.unisys.com/hurricane/w_pacific/index.html
Global Warming

Web Source: U.K. Met Office http://www.met-office.gov.uk/research/
The Urban Heat Island
Web Source: http://www.mech.tohoku.ac.jp/mech-labs/tssaitoh/
Lab Exercise 2: The Urban Heat Island
http://www.ems.psu.edu/~nese/baltmin.txt
http://www.ems.psu.edu/~nese/woodmin.txt
Acknowledgement
Virtually everything included in this write-up was produced by other hard-working individuals. I have freely taken images from various web sites and claim no responsibility (and deserve no credit) for their creation. Most images can be accessed from their original pages through the links provided. The labs were originally offered as part of the introductory meteorology course offered by Dr. Jon Nese at Penn State Hazleton.