|
Ozone: Bad
>> Toxic to plants and animals
>> 10% of all ozone is in the troposphere, much of which is near the ground
>> Tropospheric ozone is mainly a by-product of pollution
Ozone: Good
>> Blocks cancer-causing UV light from
the Sun
>> 90% of all ozone is in the stratosphere
>> Produced naturally when oxygen reacts with sunlight
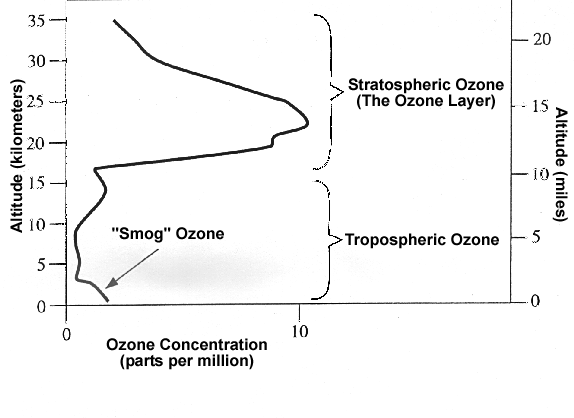
The distribution of ozone throughout
the atmosphere can be seen below in Figure 1.
|
 |
|
Figure 1:
The diagram above shows the distribution of ozone throughout the troposphere
and stratosphere. Notice that there is a fairly significant amount of
ozone found near the surface of the Earth and in the Ozone Layer. |
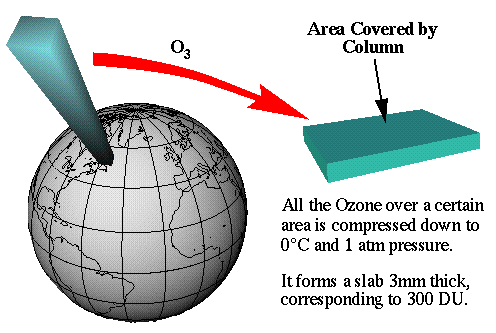
Measuring Ozone
>> Measured as a column total in
Dobson units
>> The average global ozone is 300 DU
|
 |
|
Figure 2:
The image above illustrates that if all the ozone over one given point would
be compressed into 1 layer of pure ozone, it would measure 3 millimeters
thick. This corresponds to 300 DU. |
It doesn't take much ozone to protect us from ultraviolet radiation, in fact,
If the average global ozone at any given point was
combined into one pure layer of ozone, it would only result in a 3 millimeter
thick layer. Figure 2, found to the right, illustrates this.
Ozone Production
>> Most ozone is produced in the
tropics where the sun is the strongest
>> The stratospheric general circulation carries the ozone from the summer
hemisphere to the winter hemisphere
>> Tropical levels of ozone remain fairly constant throughout the year
>> Mid-latitudes have the largest ozone concentration in the spring and the
least concentration in the fall
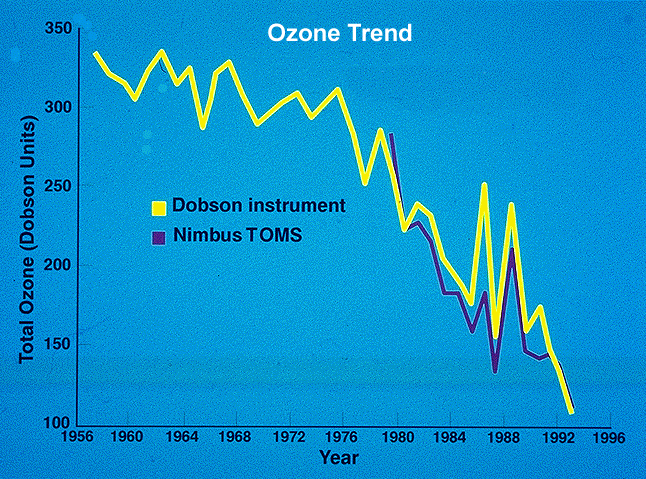
Decrease in Ozone
>> Satellite and balloon data show a
definite decrease in ozone
|
 |
|
Figure 3:
The figure above shows the drastic decrease in ozone since 1956. |
The detection of ozone by satellites
and weather balloons have shown a decrease in ozone. From 30 to 50 degrees
North latitude an 8% decrease in ozone has been observed since the 1980's.
The most drastic decrease in ozone has occurred over Antarctica, where ozone has
decreased up to 3% PER YEAR. The trend in ozone levels can be seen in
Figure 3 to the left. It should be noted that in the years after this graph was
produced the rate of decrease has slowed, but recovery has not begun.
>> The reason for the ozone decrease
|
 |
|
Figure 4:
The image above shows how CFC's released into the atmosphere work to destroy
ozone. |
The decrease in ozone is largely due
to the man-made pollutant, CFC's. Chlorofluorocarbons are very stable
chemicals which are found throughout the troposphere. This non-water
soluble chemical reacts with sunlight in the stratosphere, which causes chlorine
atoms to be freed. Once the chlorine atoms are freed from the CFC's, they
begin to destroy the ozone found throughout the stratosphere. The process
of ozone destruction can be seen in Figure 4 to the right.
|
 |
|
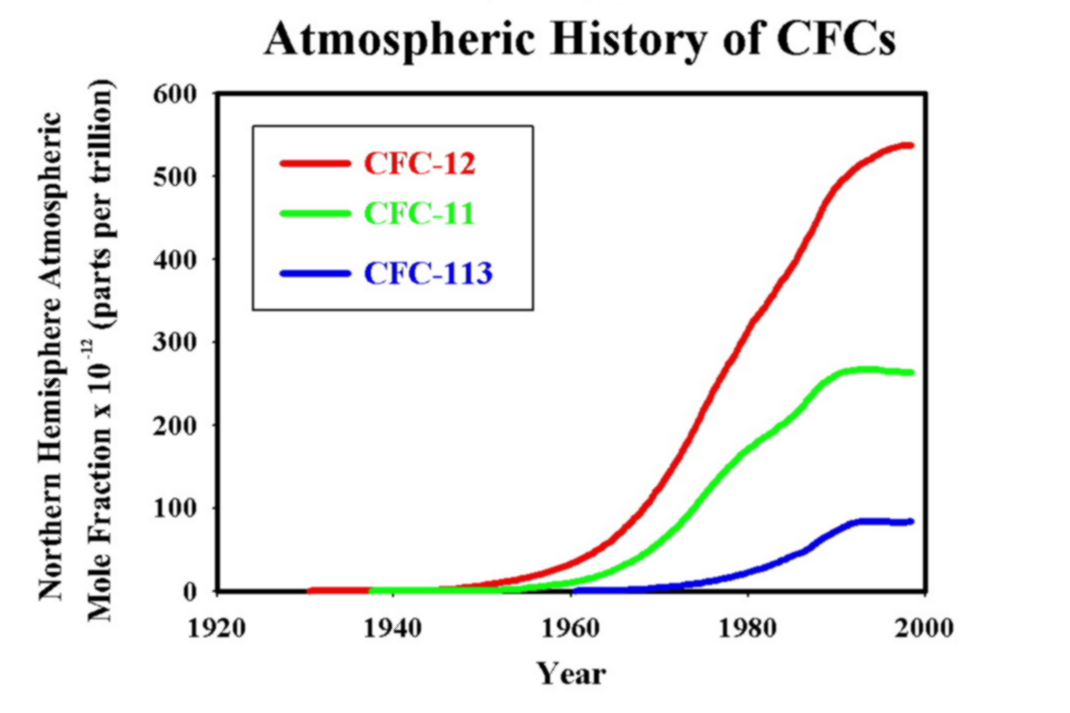
Figure 5:
The figure above shows the trend in CFC levels since 1920. Notice that
all three types of CFC's increased drastically from the 60's through the 90's, but
it appears that levels have now peaked. |
In an effort to reduce CFC production,
the Montreal Protocol was adopted in 1987. However, it was determined that
this protocol would only delay the CFC's impact on global ozone. In order
to more effectively combat this problem, the Copenhagen Amendment was added to
the protocol. This amendment stated that CFC's will reach their pre-1980
levels by 2025. Figure 5, found to the left, outlines the
atmospheric history of CFC's.
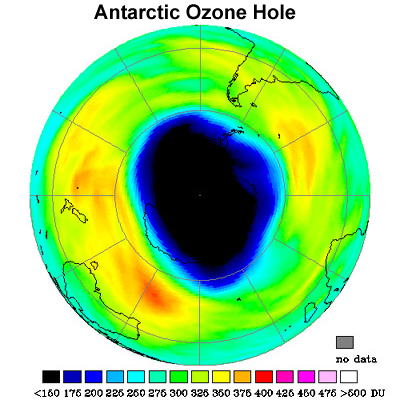
The Ozone Hole
>> Found over the polar regions,
especially Antarctica
>> Ozone almost totally destroyed at an altitude of 15-20 kilometers
>> Polar Vortex: Jet stream that circles the pole and allows almost no mixing of
polar air with air outside of the vortex
>> Air over the poles is very cold and allows for the formation of Polar Stratospheric
Clouds (PSC's)
The formation of Polar Stratospheric Clouds
over both poles aids in the destruction of ozone
throughout the stratosphere. In the polar regions, up to
2% of the total ozone per day can be destroyed. A picture of the ozone hole over Antarctica
can be seen in Figure 6 below.
|
 |
|
Figure 6:
The image above depicts the ozone levels over a good portion of the Southern
Hemisphere. Notice the extremely low levels of ozone found over
Antarctica. |
|