|
Radiation
>> Everything radiates!
>> Described by "wavelength" and "amplitude"
 |
|
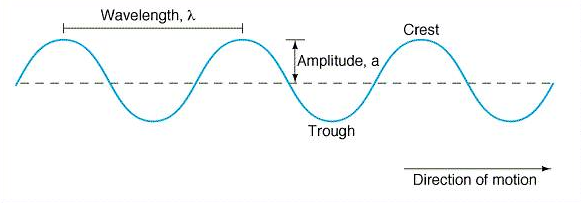
Figure 1:
Above is an illustration of the basic structure of a wave. |
All waves can be described
by the same two parameters, the wavelength and amplitude. The wavelength
is defined as the distance between one peak or crest of a wave and the next
corresponding peak or crest. The vertical distance from the midpoint of a
wave to a crest or trough is called the amplitude. Figure 1, seen
above, details the basic structure of a wave.
 |
|
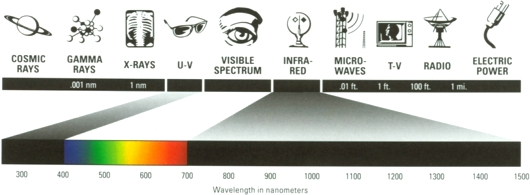
Figure 2:
The image above details the array of wavelengths that make up the
electromagnetic spectrum. |
The electromagnetic spectrum, seen
above in Figure 2, is a collection of wavelengths of radiation ranging
from radio waves to cosmic rays.
>> Wavelength of peak emission
 |
|
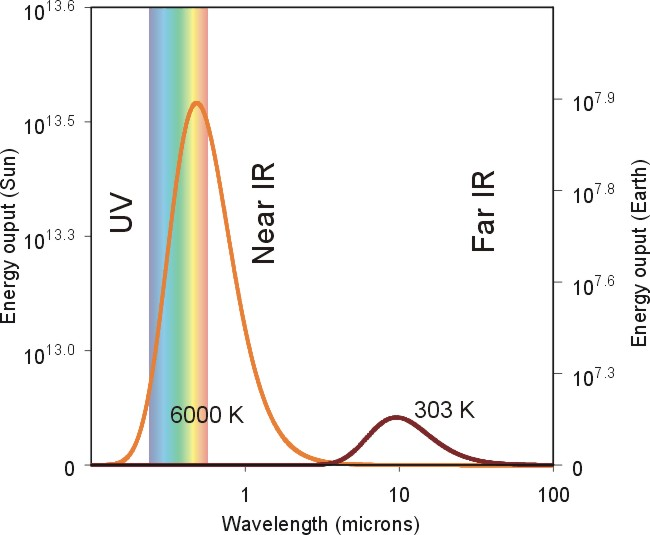
Figure 3:
This figure shows the wavelength of peak emission for the sun and the earth.
Notice that the peak wavelength for the sun is at a shorter wavelength due
to its higher temperature. |
While all objects emit radiation at
all wavelengths, the amount of radiation emitted usually peaks at a certain
wavelength. The wavelength of peak emission depends on the temperature of
the object emitting radiation. A higher temperature will cause the
wavelength of peak emission to be at a shorter wavelength.
Temperature
>> A measure of the average kinetic
energy of the molecules of an object
|
|
|
Figure 4:
The application above shows the relationship between the temperature of an
object and the average kinetic energy of its molecules. If you do not
have the Macromedia Shockwave player on your computer,
click here to download it. |
The temperature of an object is
directly related to the average speed of the molecules that make up the object.
If the temperature of an object is high, its molecules will move at a greater
speed and will, therefore, have a greater average kinetic energy. This can
be seen in the demonstration to the left.
>> The greater the average kinetic
energy, the higher the temperature
>> As temperature increases, the amount of emitted energy (radiation) increases,
while the wavelength of peak emission decreases.
The increase in emitted energy and
decrease in the wavelength of peak emission can be seen by revisiting
Figure 3. In this
figure, the amount of radiation emitted is plotted as a function of the
wavelength of radiation for both the sun and the earth. If you compare the
amount of radiation emitted by the two celestial bodies, you can clearly see
that the sun emits much more radiation than the earth. You also notice
that the wavelength of peak emission for the sun is significantly less than that
of the earth. Both of these effects are a result of the sun having a much
higher temperature than the earth.
Balance of Radiation
>> Absorptivity (color)
>> Intensity (sun angle)
>> Net heating and cooling
Absorptivity: Transparent versus Opaque
>> Ozone versus Ultraviolet
radiation
>> Greenhouse gases (CO2 and H2O)
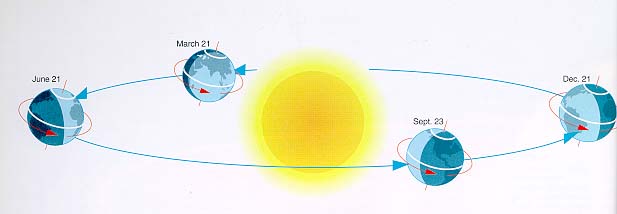
Annual Cycle: Tilt of the Earth's Axis
>> Tilt and Seasons
The four season experienced by many
people around the world are due solely to the tilt of the earth's axis. As
the earth revolves around the sun, the tilt of the earth's axis causes the
planet to be oriented differently with respect to the sun. This can be
seen in Figure 5 below.
|
|
|
Figure 5:
The image above shows how the tilt of the earth's axis causes the four
different seasons across the planet. |
As we all know, with changing
seasons comes changing weather and temperatures. The changing weather and
temperatures are also a direct result of the tilt of the earth's axis. The
seasonal change in temperatures can be seen in Figure 6 below.
|
|
|
Figure 6:
The figure above shows the progression of global temperatures throughout the
year. The changes are based on the tilt of the earth's axis and the
resulting seasons. |
Home
Quick Notes
|