|
Thermometers
>> Types of Thermometers
 |
|
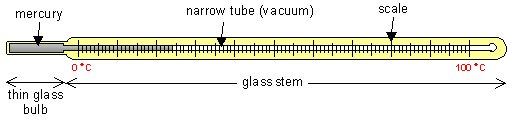
Figure 1:
This figure illustrates the basic parts of a liquid-in-glass thermometer. |
There are three basic types of thermometers. The liquid-in-glass thermometer is the most commonly
used and probably the most familiar type of thermometer. This type of
thermometer works because the liquid enclosed in the glass tube will
change its volume as the temperature changes in a known fashion. A basic liquid-in-glass
thermometer can be seen in Figure 1 to the right.
 |
|
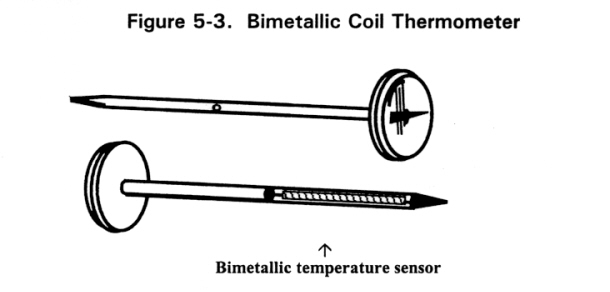
Figure 2:
This figure shows the basic structure of a bimetallic thermometer.
Notice the bimetallic coil used to determine the temperature. |
Another type of thermometer is a bimetallic thermometer. A bimetallic
thermometer is made up of a coil of two different metals and a dial on which the
temperature can be read. The bimetallic coil of the thermometer bends due
to the different expansion rates of the two metals of the coil. The
temperature on the dial is determined by the amount that the bimetallic strip
bends. An illustration of a bimetallic thermometer can be seen to the left
in Figure 2.
 |
|
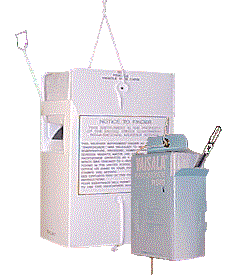
Figure 3:
The picture above shows the instrument package from a weather balloon, or
radiosonde. Included in this instrument package is an electronic
thermometer. |
The third type of thermometer is known as an electronic thermometer. Included in the
instrument package of a weather balloon is an electronic thermometer. An electric
current is monitored, with the amount of current directly related to the temperature of
the thermometer. A picture of the radiosonde
instrument package can be seen in Figure 3.
>> Site Selection
|
 |
|
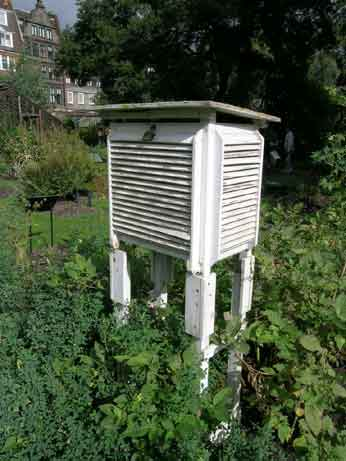
Figure 4:
The picture above is of a Stevenson Screen. Notice that the area is shaded and the white-painted shed is well
ventilated. |
Thermometers are very useful tools for meteorologists, but the
placement of a thermometer will make a world of difference when taking
temperature measurements. In order to obtain an accurate temperature
reading from a thermometer, it must be placed in a well ventilated and shaded
area at a fixed height above the ground. An example of good thermometer placement
can be seen in Figure 4.
Diurnal Range
of Temperatures
>> Mirrors annual cycle
>> Change in Sun angle
>> Maximum temperature lags maximum solar radiation
 |
|
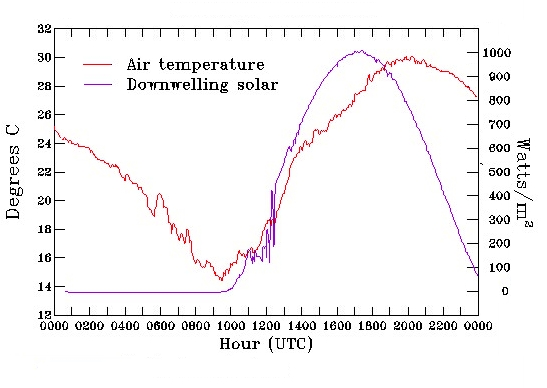
Figure 5:
The image above depicts the diurnal cycle in both temperature and incoming
solar radiation. Notice that the maximum temperature lags the maximum
incoming solar radiation. |
The daily change in temperature is very
similar to the annual temperature cycle. Both cycles depend on the
amount of solar radiation hitting the surface of the earth at any given time.
Throughout one day the amount of incoming solar radiation changes due to the
change in the sun angle as it rises and sets. The impact of the large
change in the angle of the sun can be seen in the flashlight demonstration from
Lecture Two.
The diurnal cycle of temperaure and the annual
cycle both show a lag between maximum incoming solar radiation and maximum temperature.
While the maximum solar radiation occurs when the sun is nearest to
directly overhead (solar noon), the maximum temperature doesn't occur until a
few hours later. This relationship can be seen in Figure 5.
Effect of
Cloudiness on Diurnal Temperature Range
>> Presence of clouds decreases the
diurnal range of temperatures
>> Less solar radiation reaches the surface: lower daytime temperature
>> Terrestrial (IR) radiation absorbed and emitted by clouds at night: higher
nighttime temperature
 |
|
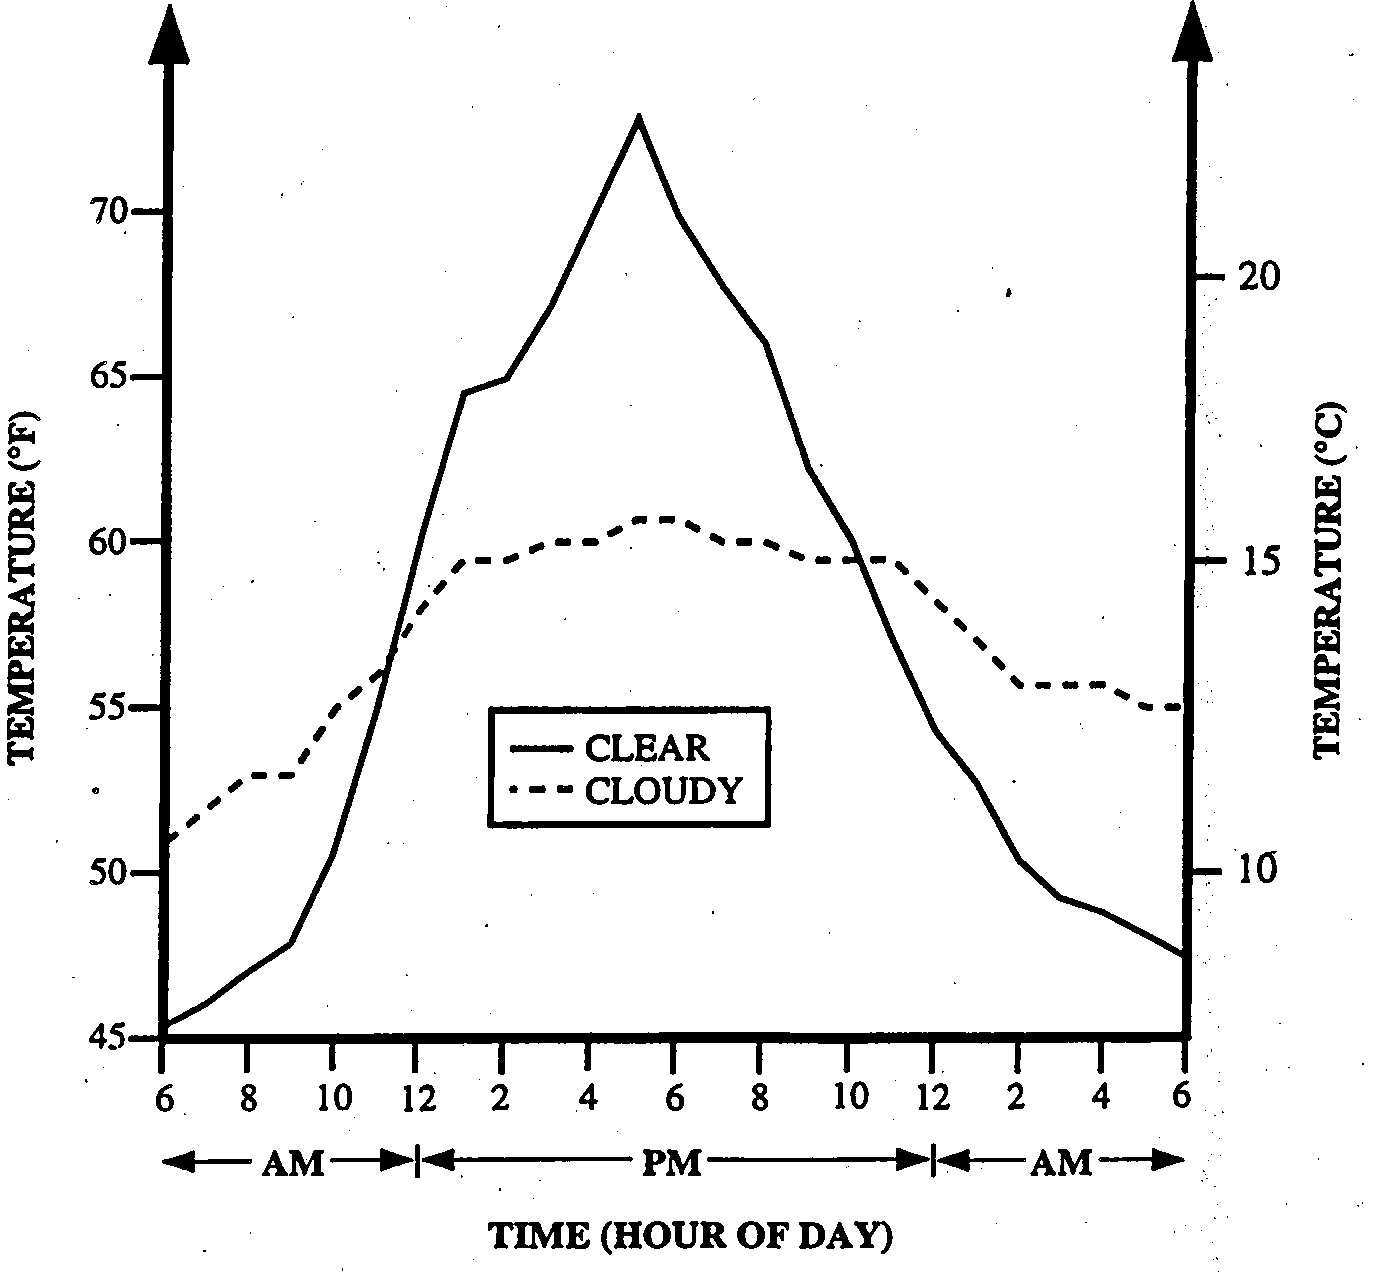
Figure 6:
The two daily temperature cycles found above illustrate the impact of cloud
covered skies on daytime and nighttime temperatures. |
As we all know from living in State
College, not every day is guaranteed to be perfectly clear and sunny. As a
result of this, the diurnal temperature cycle can vary greatly. One of the
largest impacts on the diurnal temperature cycle is the presence of clouds.
As mentioned above, clouds keep daytime temperatures cooler and nighttime
temperatures higher. The modulation of the diurnal temperature cycle due
to the presence of clouds can be seen in Figure 6 to the left.
Seasonality
>> Greater temperature change occurs
over land than over water
>> Higher heat capacity of water
 |
|
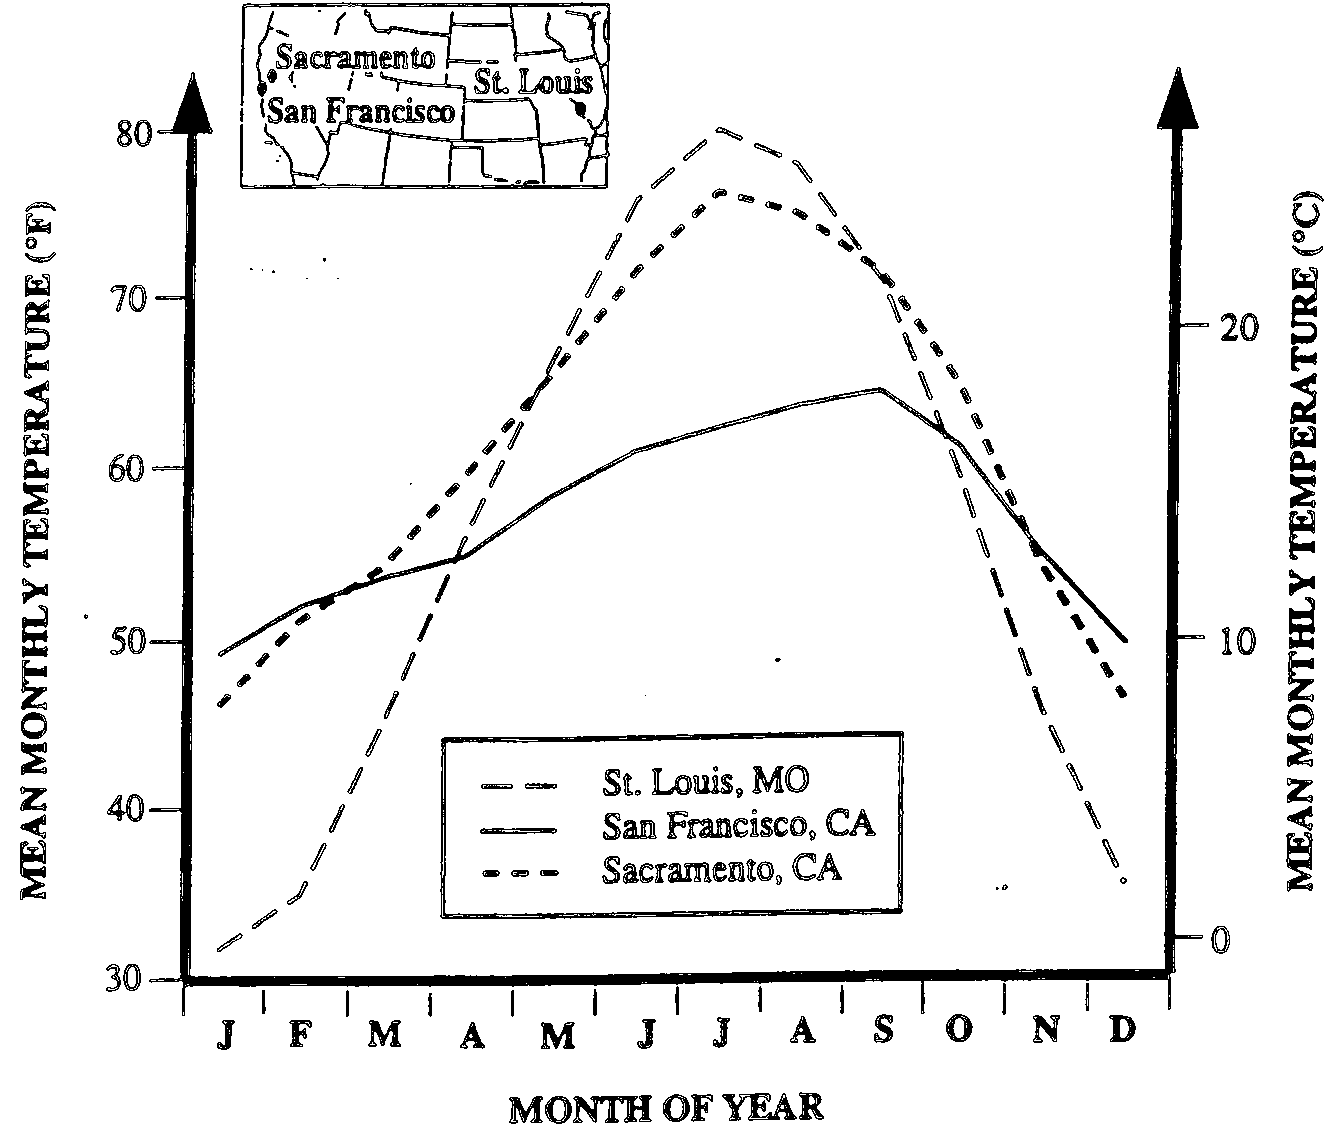
Figure 7:
The graph above shows the mean monthly temperatures for Saint Louis,
Missouri, and San Francisco and Sacramento, California. Notice
that Saint Louis, which is furthest inland, has the greatest variation of
annual temperature, while coastal San Francisco experiences less seasonality. |
As discussed in
Lecture Three, water
takes a much longer time to warm or cool than land. Thus,
land areas that are close to bodies of water tend to have smaller annual
temperature ranges than areas further inland. This difference is
illustrated in the graph found in Figure 7.
>> Prevailing Wind Direction
The prevailing wind direction can also
have a large impact on the annual temperature cycle for any given location.
A location where the prevailing wind blows from a body of water will have a
smaller annual temperature range than if the wind blows predominantly from a large land mass.
>> Ocean Currents
Warm and cold ocean currents also
play a part in the annual cycle of temperature in coastal locations. The
effect, of course, depends on what type of ocean current is just off the coast.
In areas where a warm ocean current is present, warmer waters and, therefore, higher
temperatures will prevail year-round as compared to a location with a cold ocean
current nearby (at any given latitude). Still, prevailing wind direction will strongly determine how much of an
effect the nearby ocean has on any given location. A map of the major ocean currents can be found in
Figure 8.
|
 |
|
Figure 8:
The map above shows all of the major ocean currents. Red arrows
represent warm ocean currents, while blue arrows represent cold currents. |
|